Functionality
This section explains the basic functionality of the energy strategy algorithm. It covers three main steps, which must be executed in a row to get the algorithm up and working. The three steps cover the
calculation of the reference velocity profile,
initialization of the energy strategy,
recalculation of the energy strategy.
Reference velocity profile
At first, we need a reference velocity profile for the entire race. This profile would be time-optimal if no thermodynamic or energetic constraints were present. By this, only the driving dynamics are constraining the optimization problem. We will later use the reference velocity profile as an initial state guess for the calculation of the energy strategy. A reference velocity profile for a race consisting of 12 laps on the Monteblanco race circuit could look like in the following figure:
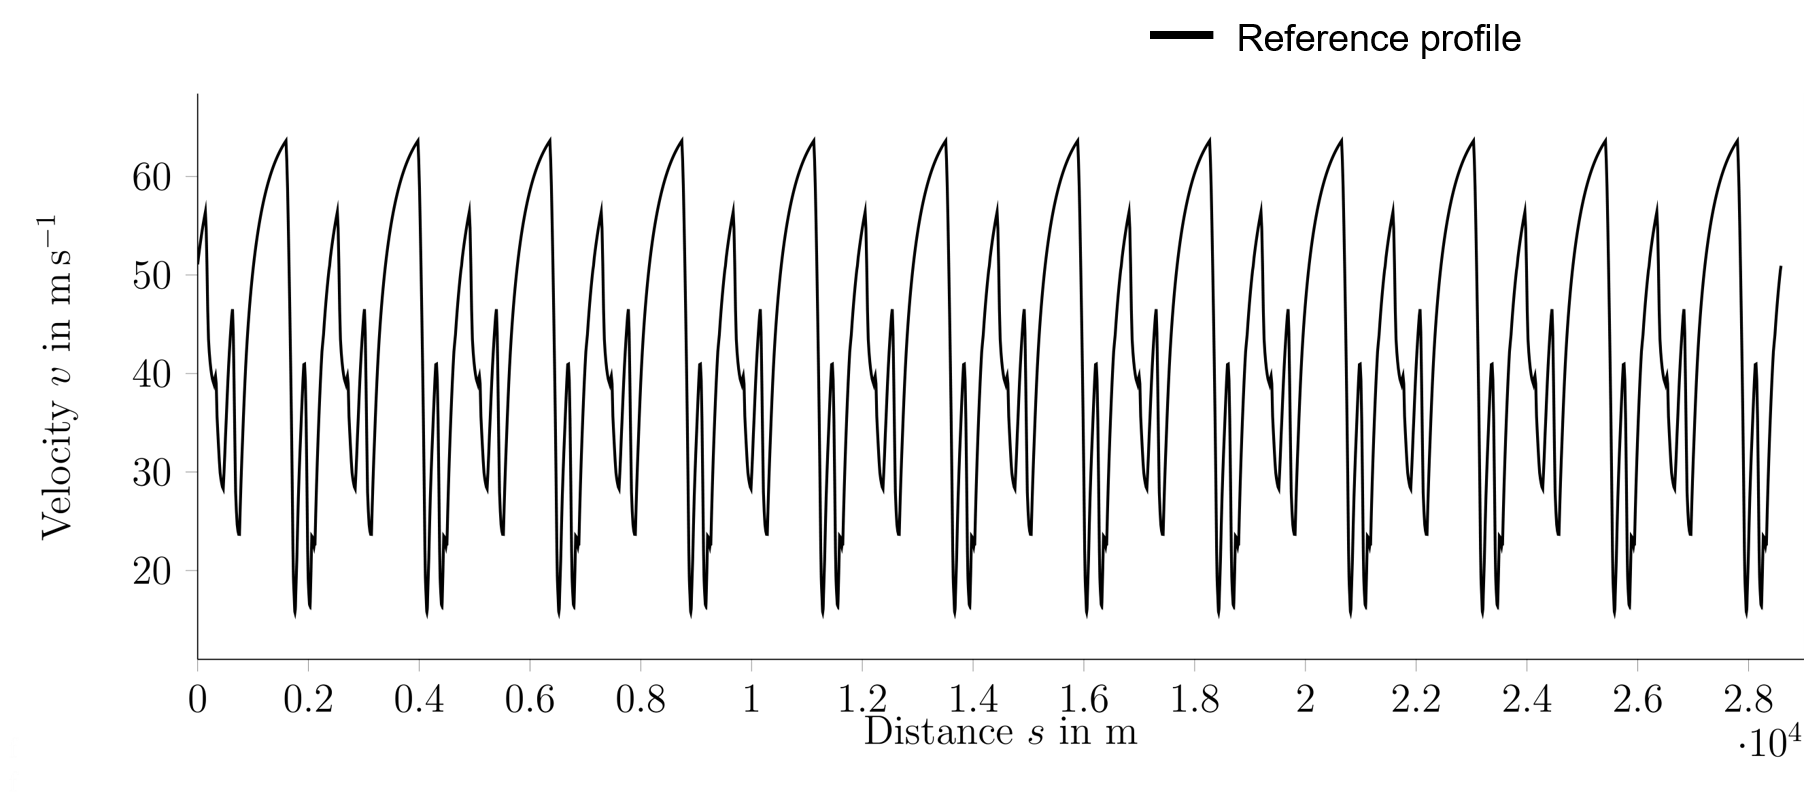
Here, you can find a code example to 1. Create Reference velocity profile.
Initialization of the energy strategy
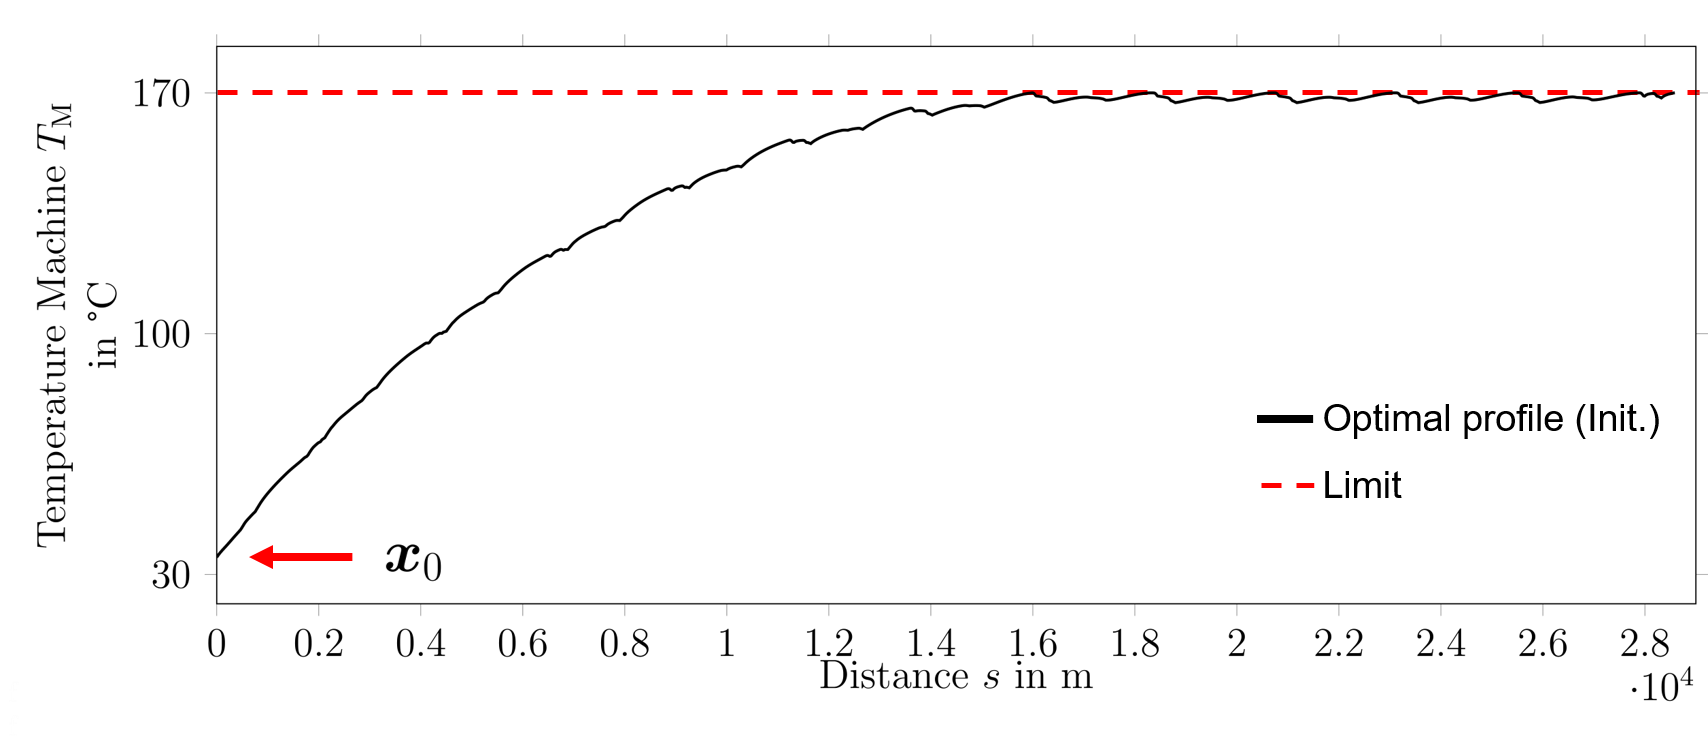
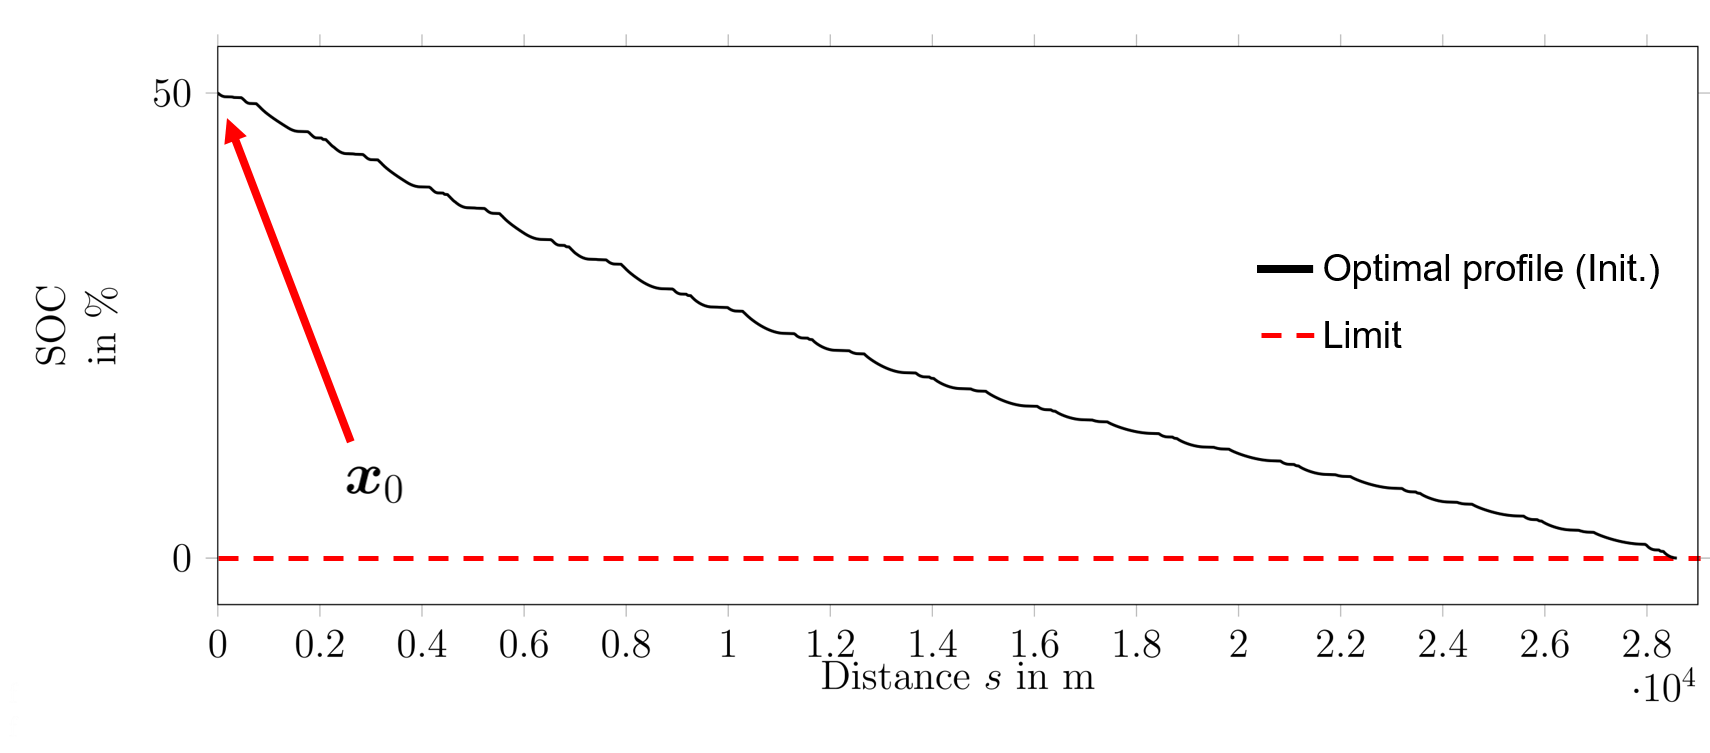
Just before the race starts, we wish to initialize the energy strategy. The powertrain states (temperature and available energy) are measured (\(\boldsymbol{x}_0\)). These information are then used to find the time-optimal velocity profile and its corresponding power:
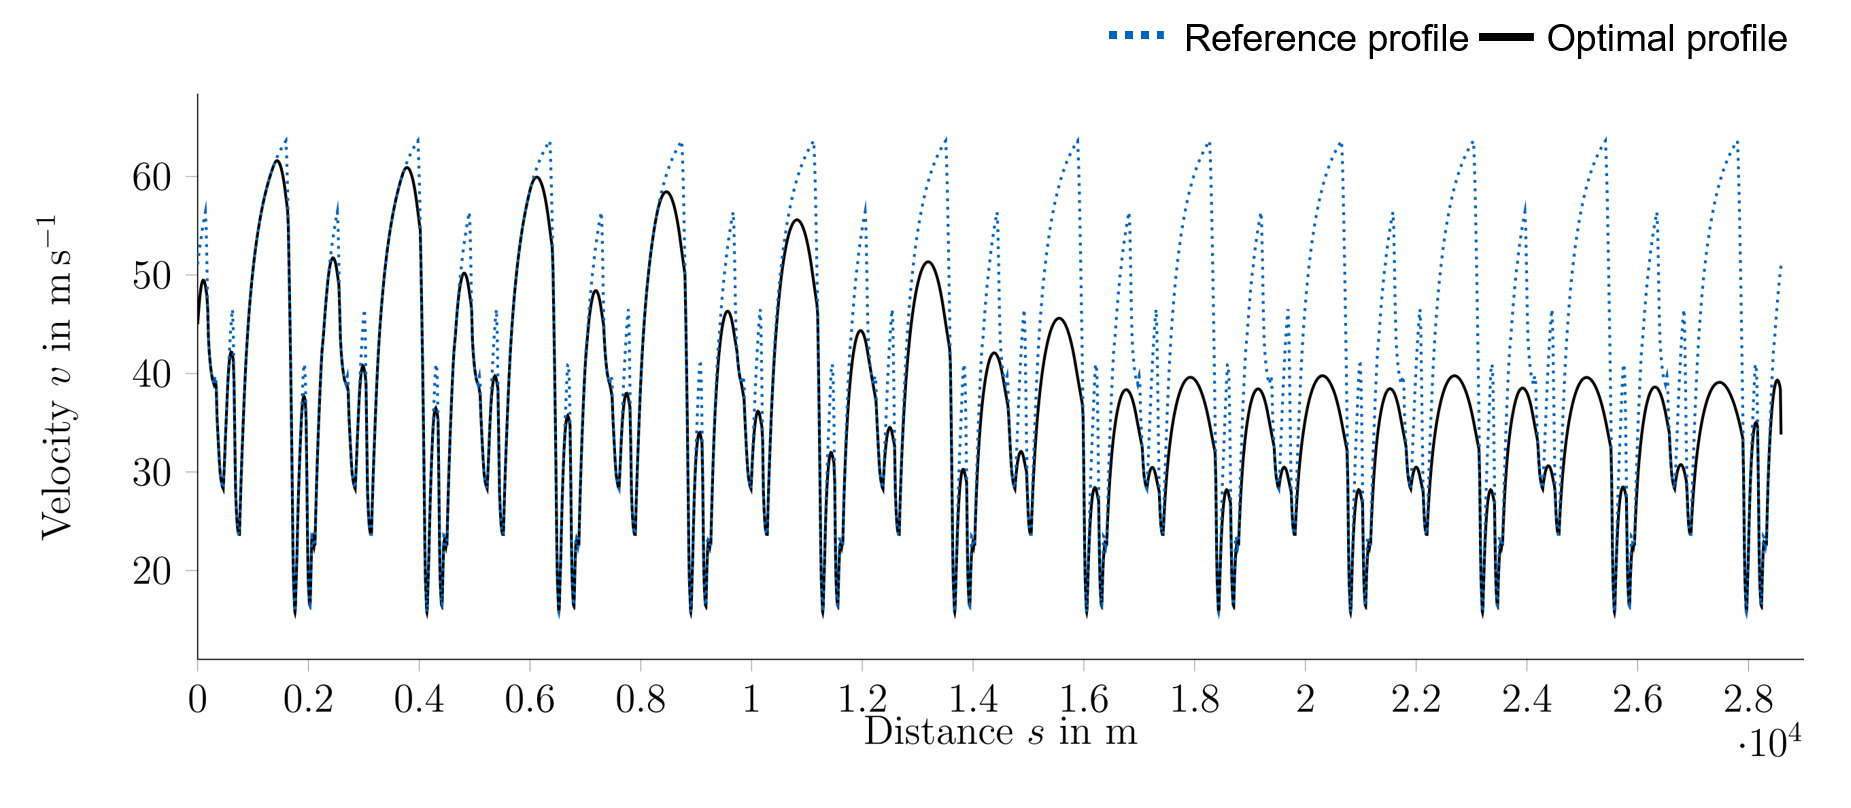
The optimal velocity profile differs from the reference velocity profile, since the temperature of the electric machine and the battery SOC limit a full-speed operation, as can be seen here:
Here, you can find a code example to the 2. Initialization of the energy strategy.
Reoptimization of the energy strategy
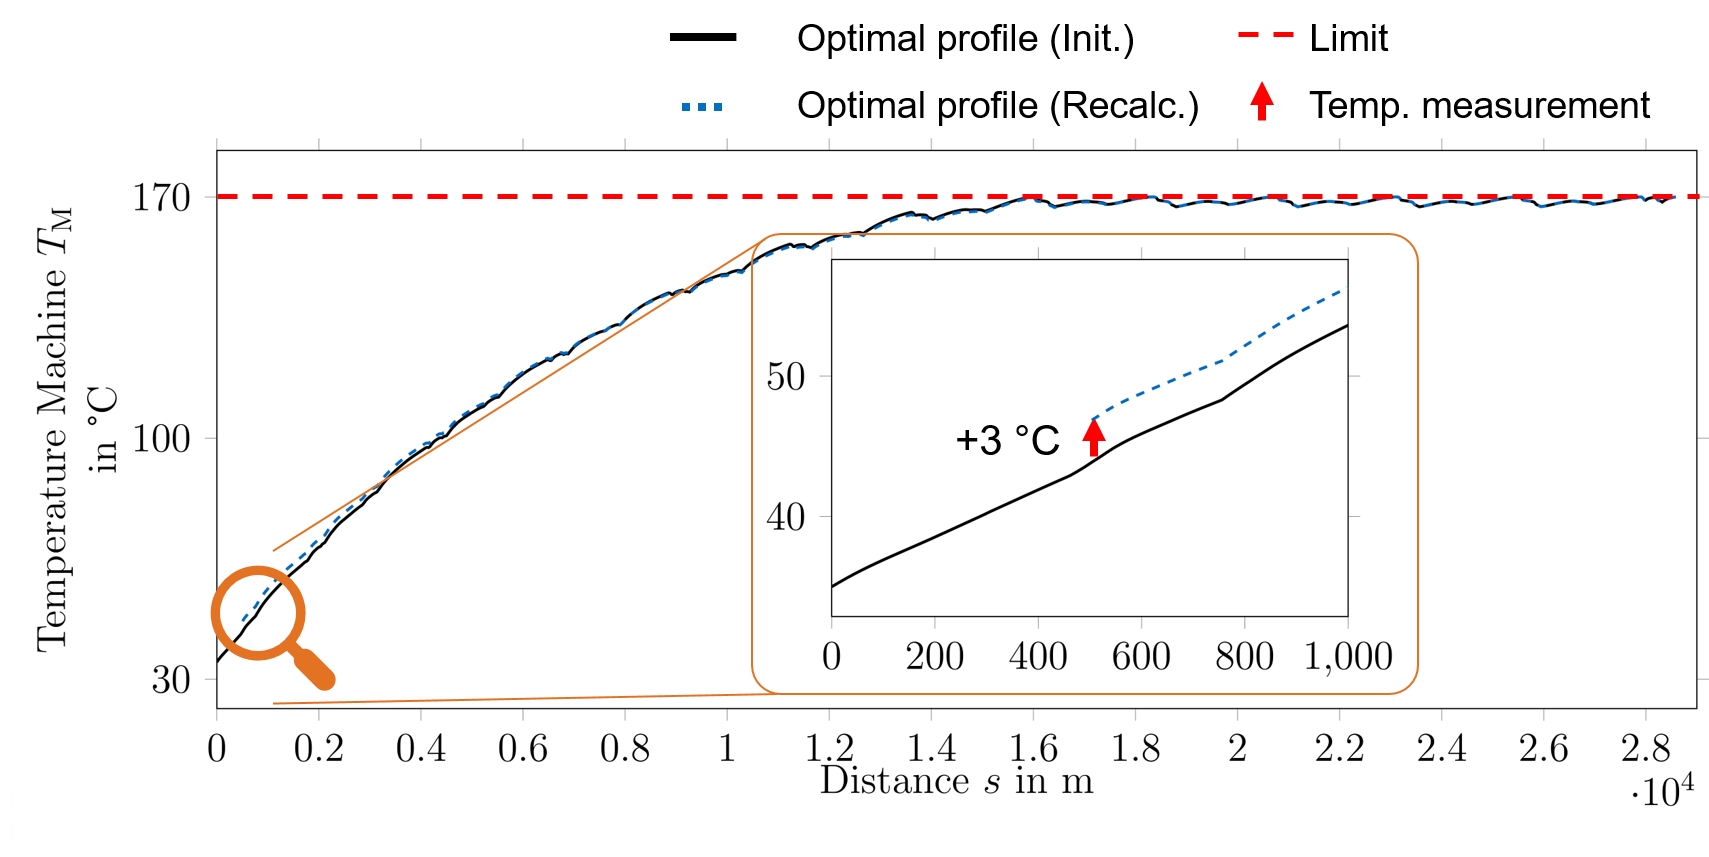
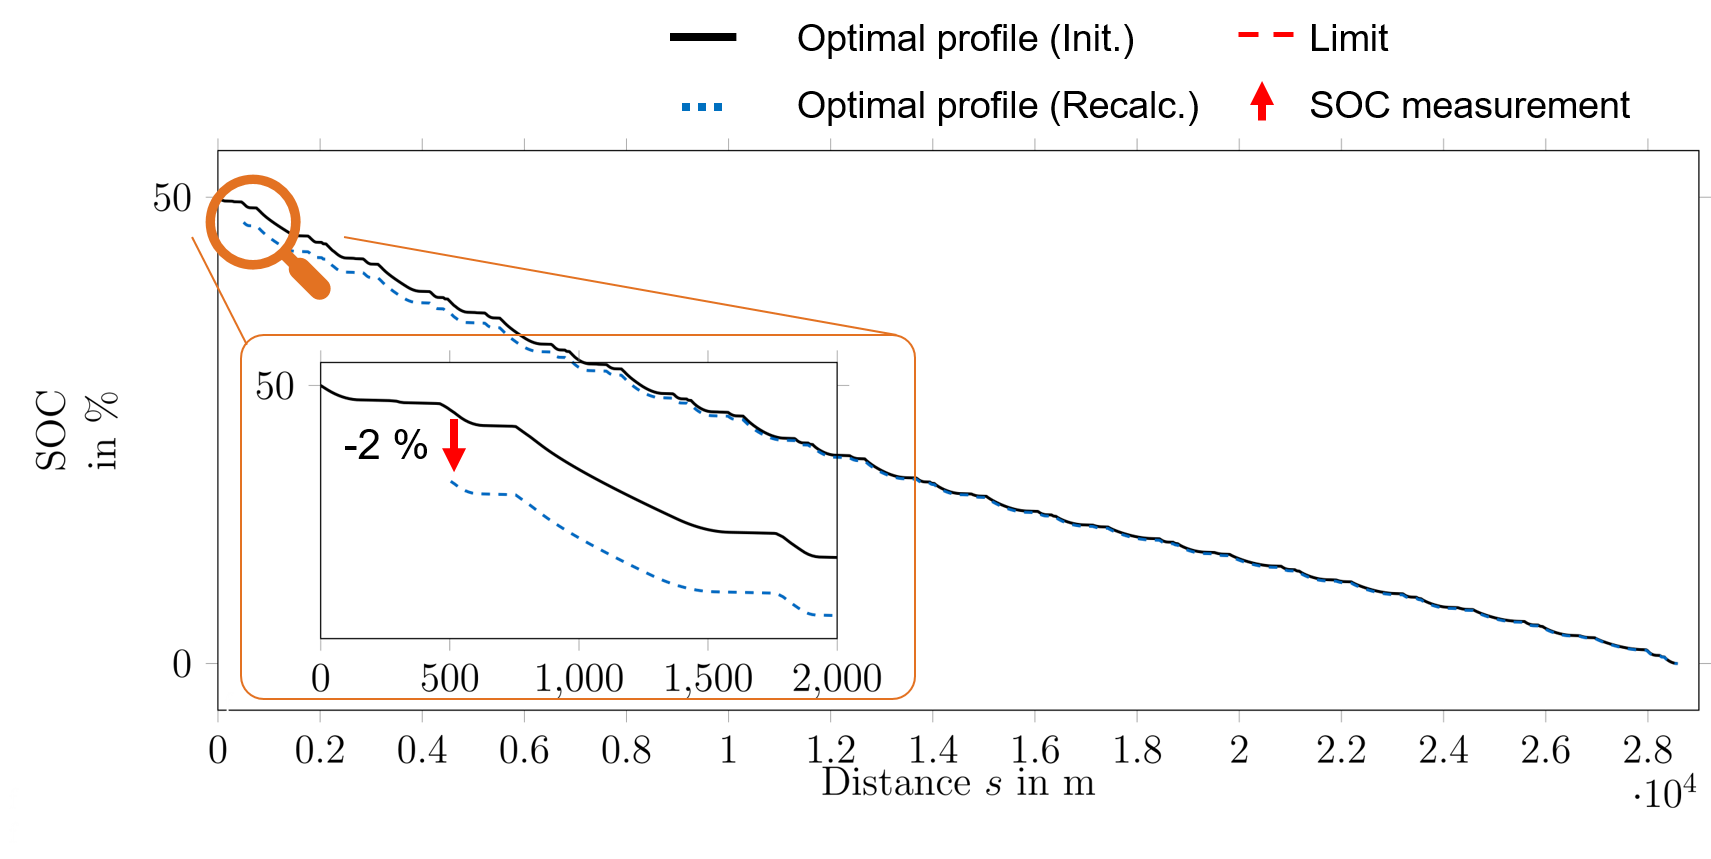
During the race, a recalculation of the energy strategy is required. Reasons for a recalculation can be model errors, disturbances or unforeseen events, like, e.g., overtaking maneuvers. In the following, the recalculation is triggered directly after an overtaking maneuver (500 m distance after the race start). Therefore, the machine temperature is 3 °C higher and the SOC 2 % less, compared to the initial plan.
The following figures show the new temperature and SOC courses, predicted by the recalculated energy strategy:
The new velocity and power profiles, starting from the recalculation point (500 m), can be seen here:
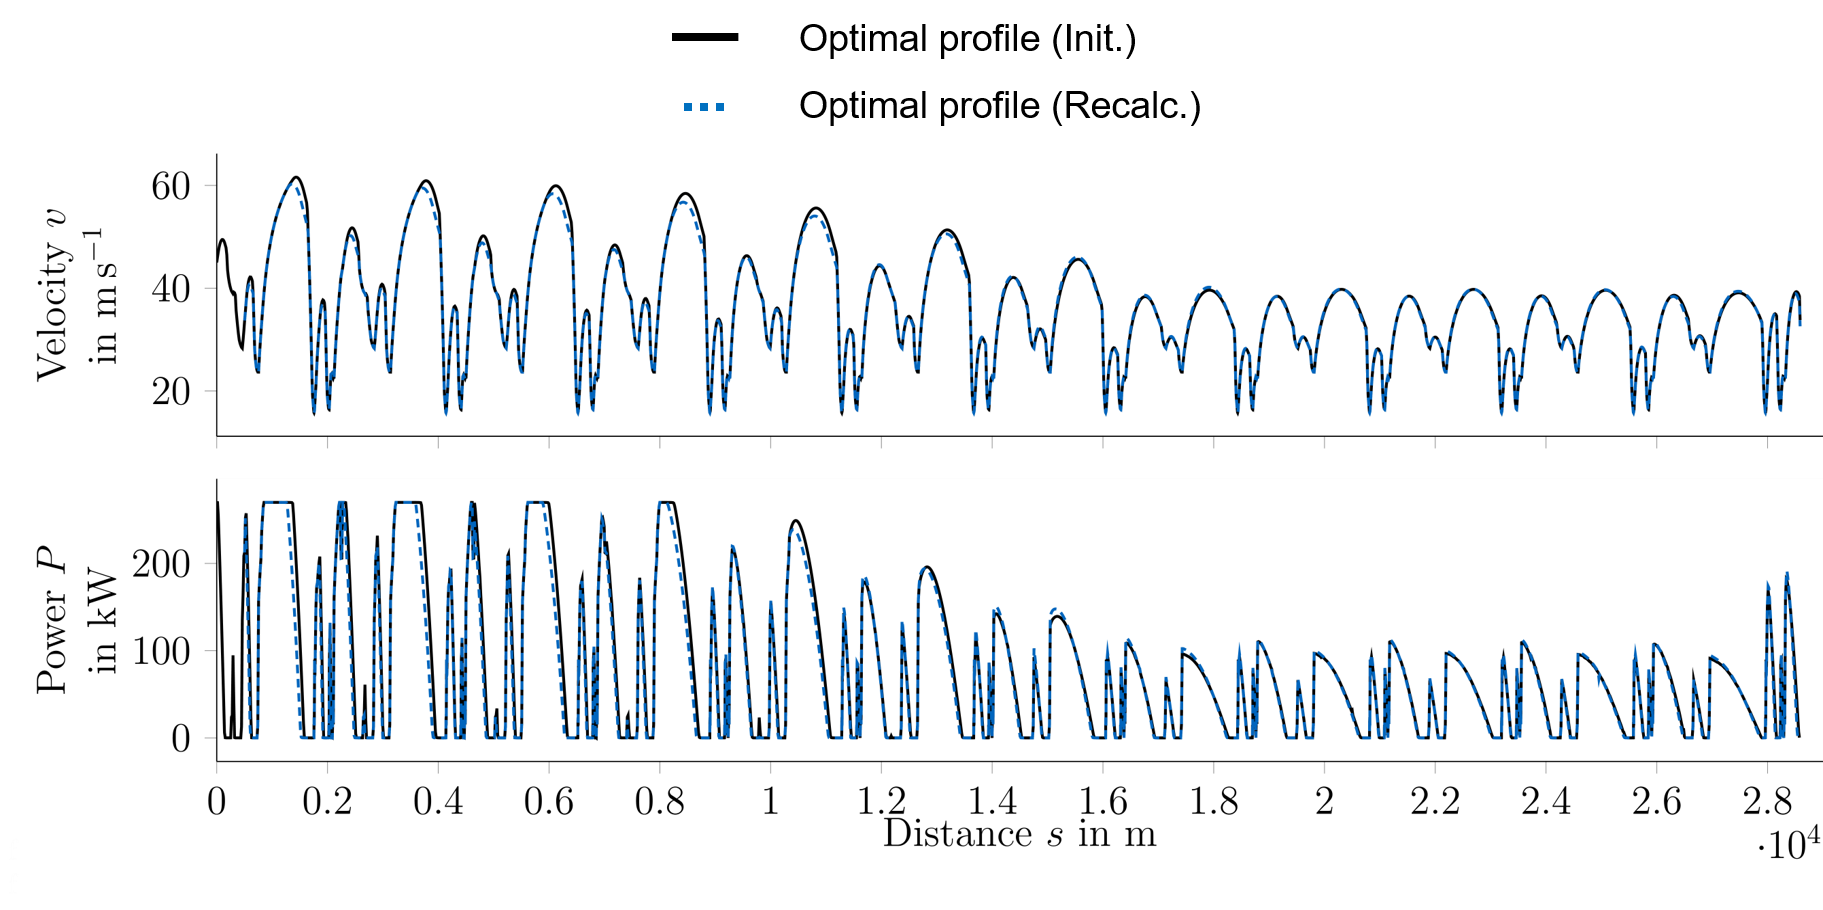
Here, you can find a code example to the 3. Reoptimization of the energy strategy.